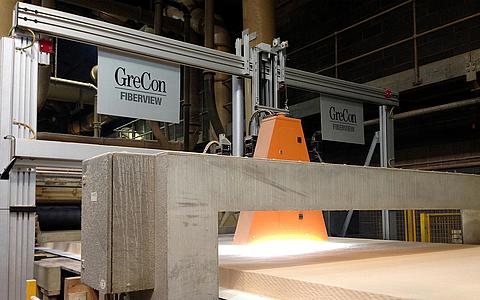
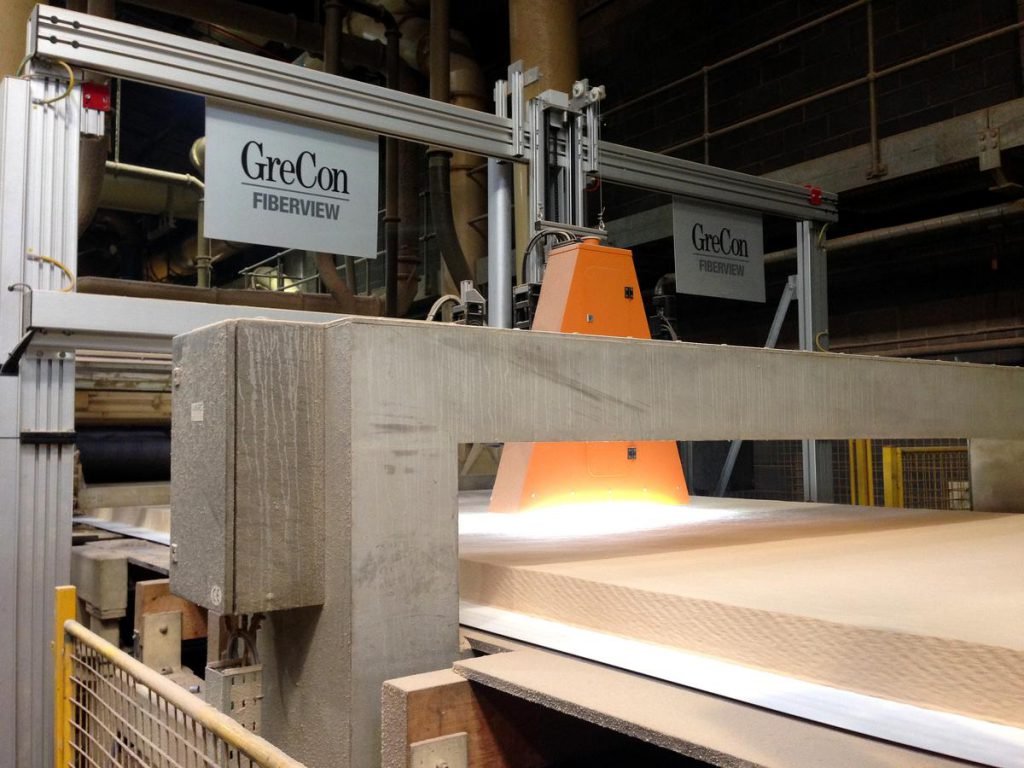
GreCon FIBERVIEW
BENEFITS AT A GLANCE
-
- Reliable, objective and representative evaluation of fibre quality
- Quality assurance and reduced customer complaints
- Control and optimisation of the refining process
- Reduced energy consumption by the refiner
MEASURING METHOD
-
The fibre mat is inspected by a camera system after the pre-press across a width of about 400 mm. Constant measuring conditions are created by automatic height adjustment of the camera and illumination unit including light regulation, independent of panel type and ambient conditions. The shives are automatically detected and classified by three image processing steps. This process is accomplished continuously – usually every 3 s – during the production so that representative information on the fibre quality and the inspection of the surface is available in real time. With this technology, it is possible for the first time to evaluate the refining process objectively. The energy consumption of the refiner can be optimised depending on the required fibre quality. For example, the process can be directly influenced by changing the distance of the refiner discs, thus reducing energy needed to produce optimal sized shives.
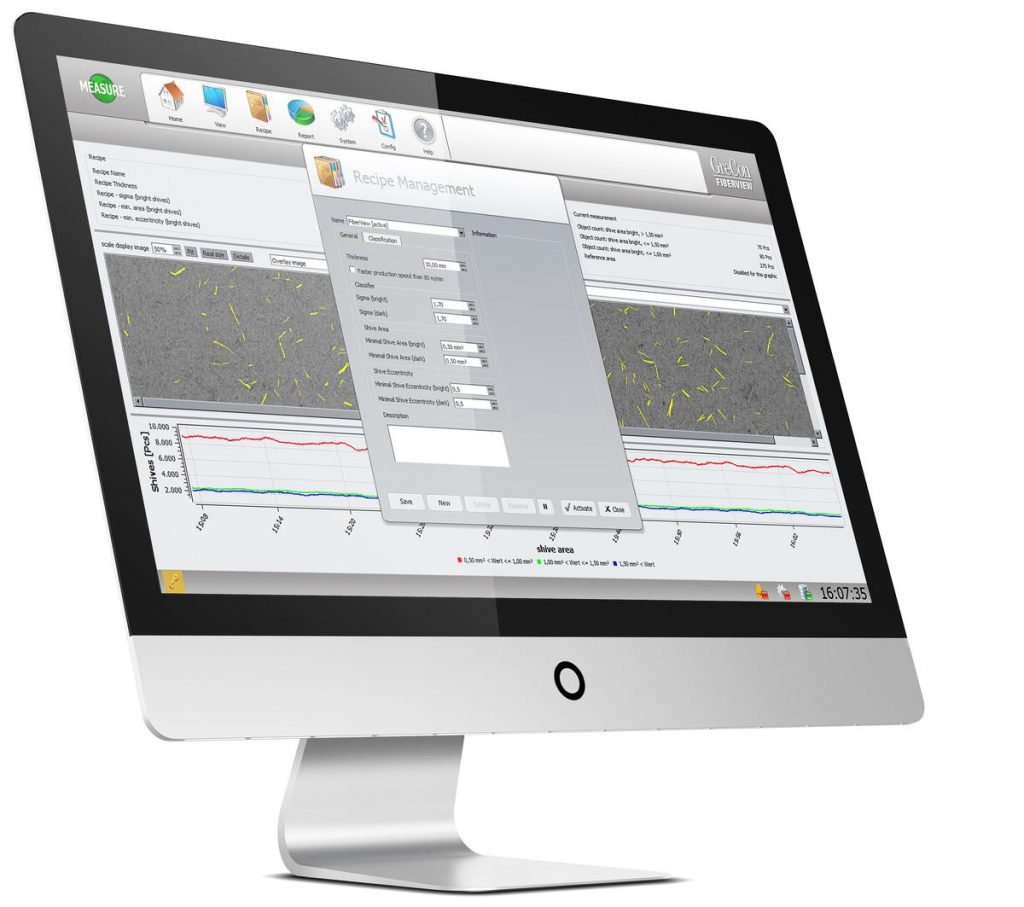
SOFTWARE FUNCTIONS AND VISUALISATION
-
The visualisation is the core of the software. The recorded measuring data is collected, registered and graphically processed. The easy menu structure which is adapted to all measuring systems makes an intuitive and user-friendly operation possible.
The ergonomically designed software based on the Windows operating system allows an easy handling of the system by the operator. The recorded measured values are processed and displayed in a clearly structured way.Thanks to the visualisation software in modular design, the system can be adapted to your requirements so that the operation of the plant with different applications is possible. Furthermore the surface of the visualisation software can be compiled according to your needs.
-
The measuring data is issued graphically and numerically:
- Alert if the tolerances are not observed
- Display of the position in which the tolerances are not observed
- Freely configurable display of numerical parameters as information on the production type or statistics.
Graphical display of:
- the original camera image on the top side of the mat
- the representation of the threshold image
- the representation of the shive objects determined
- the long-term representation of the features (in this case, the surface) of the individual shive objects in three classes
- and many more
Numerical display of:
- the configuration parameters
- the mean density of grey values
- and many more
-
The system can be adapted optimally to the different requirements via recipes. The structure of the recipe management is very easy. The input of the panel-specific data enables the operator to start the measurement with only few mouse clicks. The start of a measurement and the necessary selection of a recipe make the integration of the measurement system into the process chain possible.
All default values of a production type are saved in the recipe management. Besides the production parameters, as e.g.
- panel thickness
- panel width
- panel length
- raw density
- tolerances
also all measuring-specific parameters are filed under the production type. When the production type is loaded again, all necessary parameters are available again
-
- Any panel data is stored in an SQL data base together with the recipe parameters and the measuring results.
- Display of the position and the scope of the violated tolerances of historical panels.
- Easy search function via date and time.
- Export of panel data.
-
-
Individual time-relevant reports as e.g. the shift and month reports can be generated from the data base.
The graphic presently shown on the screen can be printed out by pressing a button. Furthermore it is possible to print out a numerical report in case of a change of the production types or the shift.
It is possible to generate different reports automatically and store or print them, as for example:
- shift report
- type report
- graphic report
Furthermore it is possible to print out a screen shot of the history for statistical purposes. The data can also be exported from the history management in the standard file format XLS.
-
APPLICATIONS
-
- wood based panel industry: directly after the pre-press in MDF-production lines
-
Supply voltage 3 x 400 V Frequency 50 to 60 Hz Mains type 3 x phase/neutral conductor/protective conductor Power consumption 5 kVA -
Places of installation (other places of installation on request) Fibre cake (behind the prepress) Ambient temperature 5 to 45 °C Relative humidity non-condensing -
Type of material MDF Transport speed max. 120 m/min. -
Number 1 (inspection width 400 mm) Measuring process Optical Resolution (diameter of the measured spot) 100 µm per pixel (≤ 80 m/min) / 200 µm per pixel (> 80 m/min) Min. detectable default size > 0.2 mm² -
- OPC
- Ethernet
- Digital I/O