GreCon STENOGRAPH

Enabling inline raw density profile measurement with X-ray technology.

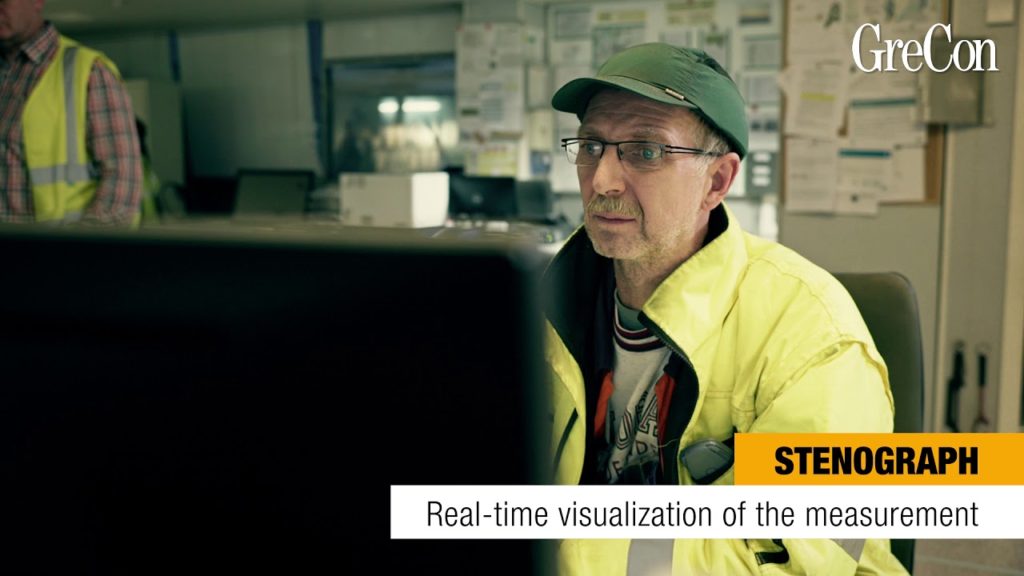
The development of the raw density profile is visualised in real time. Thus, the machine operator quickly receives reliable information that he can use for an optimum adjustment of the production process when, for example, starting up the line or changing the product. If irregularities occur, he can immediately take counter-measures. Production faults are detected and can be rectified in time.

A permanent monitoring and control of the raw density profile is part of the important parameters for a cost-optimised manufacture of wood based panels as the product properties of the wood based panels are decisively influenced by specific changes of the raw density profile.

Since the Stenograph does not need a cooling time – also not in continuous measuring operation – inconvenient “blind flights” do not occur during the otherwise usual switch-off phase.

csm__stenograph_20160713_6620_53682ba457

ADVANTAGES AT A GLANCE:

Continuous inline monitoring of the density profile

Reduction of run-in times (start-ups and product changes)

Measurement of weight per unit area

Connection to customer control via OPC

Reduction of material consumption (wood and glue) by optimising the raw density profile

Production optimisation

Import of laboratory measurements for reconciliation

DESIGN OF THE SYSTEM

All ReceivingOPT products works with an standard measuring setup consisting of up to two NIR measuring heads, the central spectrometer unit (CSU) and an evaluation computer with the product software.The sensors of the ReceivingOPT BA were installed directly to the dumping site or bunker where the material will dumped through the truck. The ReceivingOPT BA-T 2.0 and ReceivingOPT BA-T 300 are stand-alone products which have the NIR measuring heads, the central spectrometer unit (CSU) and the computer inside the housing of the system. In the ReceivingOPT BA-T 2.0 the material is put in by the user and the system brings the material with a integrated screw conveyor over the NIR measuring head. The ReceivingOPT BA-T 300 has a integrated shredder which can shrink bigger particles of the material. The material sample will put into the system from the user. The System comes with calibrations for water content, ash content and calorific value. The standard calibrations are for the use with non-frozen materials. Calibrations for frozen materials available. Additionally, data can be exported as an Excel file or to a third party system using the data interface. It is also possible to integrate to an existing weighing software of e.g. a truck scale, in order to import the values into the BA-T system to complete the entry in the goods receipt book. Additionally, the systems can automatically send the daily journal to an e-mail distribution list.

MEASURING METHOD

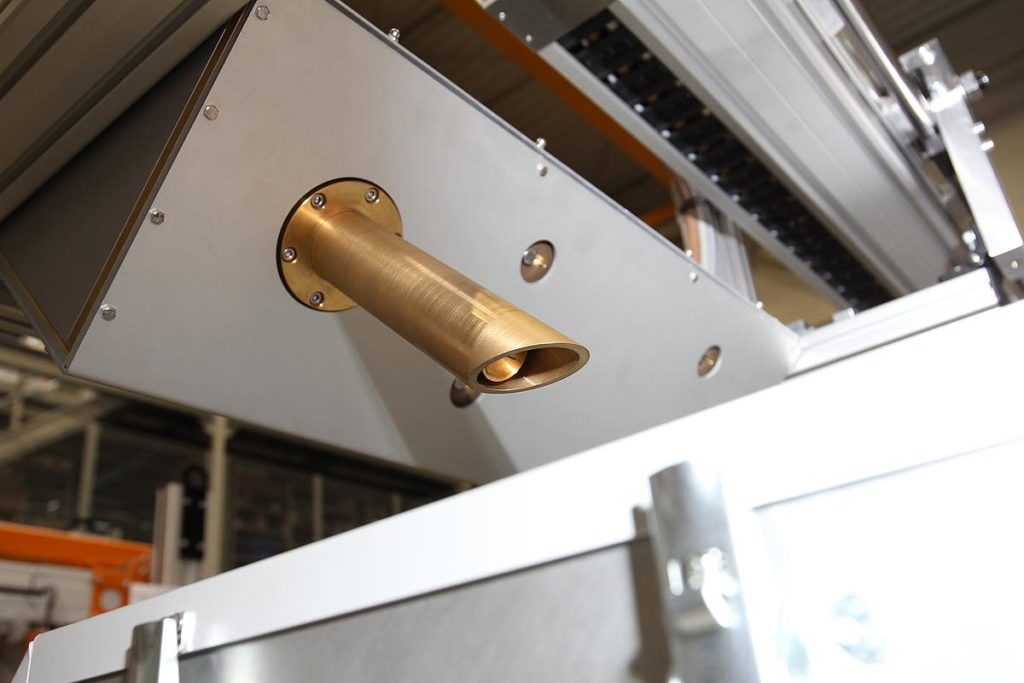
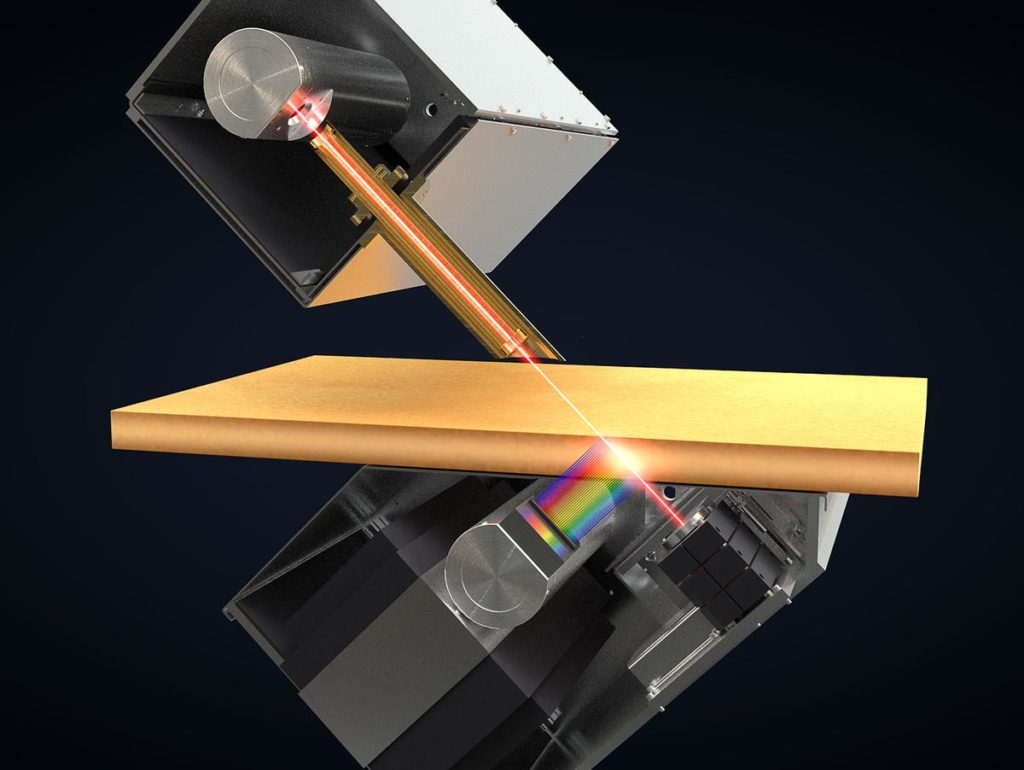
The STENOGRAPH records the raw density profile contactless by means of X-radiation. The X-ray tube sends a photon ray through the panel in an angle of 45°. A detector 1 provided at the opposite side detects the transmitted radiation and a detector 3 which is vertically movable to the ray records the photons spread in the material. This movable detector 3 scans the panel from edge to edge to be able to record the entire profile. The denser the material, the less photons reach the detector 1 by transmission and the denser the point in the material recorded by detector 3, the more photons are spread in the material and detected by detector 3. The raw density profile course is calculated over the panel thickness by combination of the measured values that are detected. The data can be used immediately and result in savings with respect to the run-in times as well as to the material.  

csm_stenograph_function_principle_20190409_4ec845d891
b YfXnxCVbs poster image

SOFTWARE FUNCTIONS AND VISUALISATION

csm_screenshot_20190305_0de6d1d511
  • The visualisation is the core of the software. The recorded measuring data is collected, registered and graphically processed. The easy menu structure which is adapted to all measuring systems makes an intuitive and user-friendly operation possible.

    The ergonomically designed software based on the Windows operating system allows an easy handling of the system by the operator. The recorded measured values are processed and displayed in a clearly structured way.

    Thanks to the visualisation software in modular design, the system can be adapted to your requirements so that the operation of the plant with different applications is possible. Furthermore the surface of the visualisation software can be compiled according to your needs.

  • The measuring data is issued graphically and numerically:

    • Alert if the tolerances are not observed 
    • Display of the position in which the tolerances are not observed 
    • Freely configurable display of numerical parameters as information on the production type or statistics.
    • Amongst others the following parameters are shown in the numerical display for every scanning process:

    a)    Maximum density of the upper/lower top layer 
    b)    Minimum density of the intermediate layer 
    c)    Average density of the panel 
    d)    The ratio of the minimum density of the intermediate layer to the average density of the panel in % 
    e)    The ratio of the max. density of the lower/upper top layer to the average density of the panel in % 
    f)    The mass per unit area

    The development of the parameters determined can be shown in a long-term graphic.

    Smoothed current density profile for an objective evaluation of the top layer compaction and the reduction of the density in the area of the transition and the intermediate layer. The profile is generated in the visualisation during measurement.

    A reference profile can be stored in the measuring window. A target/actual comparison becomes very easy in case of a superposition with the current measurement.

  • The system can be adapted optimally to the different requirements via recipes. The structure of the recipe management is very easy. The input of the panel-specific data enables the operator to start the measurement with only few mouse clicks. The start of a measurement and the necessary selection of a recipe make the integration of the measurement system into the process chain possible.

    All default values of a production type are saved in the recipe management. Besides the production parameters, as e.g. 

    • panel thickness
    • panel width
    • panel length
    • raw density
    • tolerances

    also all measuring-specific parameters are filed under the production type. When the production type is loaded again, all necessary parameters are available again.

  • Every measured raw density profile is saved in an internal SQL data base. The data of the last 100 days is stored.

    • Issue as PDF and CSV possible
    • Smoothed current density profile
    • Selection possibility of the profiles to be printed 
    • The density profile is exported on demand or automatically 

TECHNICAL DATA

  • Supply voltage 3 x 400 V
    Frequency 50 to 60 Hz
    Mains type 3 x phase/neutral conductor/protective conductor
    Power consumption 6.3 kVA
    Compressed air supply 6 bar
    Compressed air consumption 500 l/min
  • Places of installation (other places of installation on request) Press outfeed / downstream of the diagonal saw
    Ambient temperature 5 to 45 °C
  • Type of material MDF boards and chipboards
    Material/panel size max. 3000 mm
    Material/panel thickness 3 to 65 mm (3 – 40 mm or 12 – 65 mm) (other panel sizes on request)
  • Measuring process X-Ray
    Measuring range 400 to 1,500 kg/m³ (> on request)
    Resolution (diameter of the measured spot) Thickness: 0.01 kg/m³ – Cutting width: 0.01 mm
    Measuring speed 0.01 to 2 mm/s (automatic and manual setting possible)
    • OPC
    • Ethernet
    • Digital I/O
TURN KEY PROJECTS SOLUTIONS
506, Acacia Street, Sarinas Compound, Kalawaaan, 1600, Pasig City , Philippines
+63 9157461445, +63 9178812584
sales@asiifiltration.com.ph
+63 (02) 7118-7525